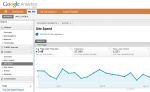
Google has for a while offered ways of measuring the speed of your website using Google Webmaster Tools and an extension to the Firefox addon Firebug called Page Speed. These are all very well but only let you know 1. how Google experiences the speed of your website and 2. how you experience the speed of your site. What it does not give you is how your visitors experience your website and this is what Google have just added to the new Analytics interface.

This is especially relevant to South African companies choosing to host their websites in the USA to save on hosting costs, but their main audience is a long way off. Being able to measure the site’s load speed and evaluate changes made to the website against these values can only be useful to anyone with the website.
Unfortunately there are some tweaks which need to be made to tracking codes to be able to take advantage of this, but our advice is the sooner this is implemented the sooner you start gathering data for future analysis.